Trying to find math inside everything else

When I started at my current school two years ago, one of the first conversations I had with my coteacher (Sam Shah!) was about grading, and coming to a compromise on our different grading systems. Often teachers will break down grades into categories, the weights of which can vary. But during that conversation I came up with what I thought of as the supra-categories, which I now use for all of my classes.

The first is Knowing Mathematics. In a standards based grading system, this would be the standards for content knowledge. In a traditional grading system, this would include things like tests, quizzes, projects, presentations, interviews – anything that shows what the student knows about the math itself.

The second is Doing Mathematics. In SBG, these would be process standards. In a traditional system, this might be classwork & homework, or class participation. I evaluate this typically with a portfolio of student work. (More on that below.)

The third is Being Mathematicians. I was doing Knowing/Doing before this, but this third category was how to incorporate some of what Sam had been doing with his portfolios, that I loved (and served a different purpose than mine). The assignments are about reflecting how the student fits into mathematical society – both on a small scale (in the class, reflecting on groupwork) and a larger scale (learning about other mathematicians, especially those from underrepresented populations, and about other mathematics outside of the scope of the class). This is also evaluated with a portfolio.


I first wrote about my portfolios in this post, and the general idea there still applies to my Doing Mathematics portfolio, but the structure is different.

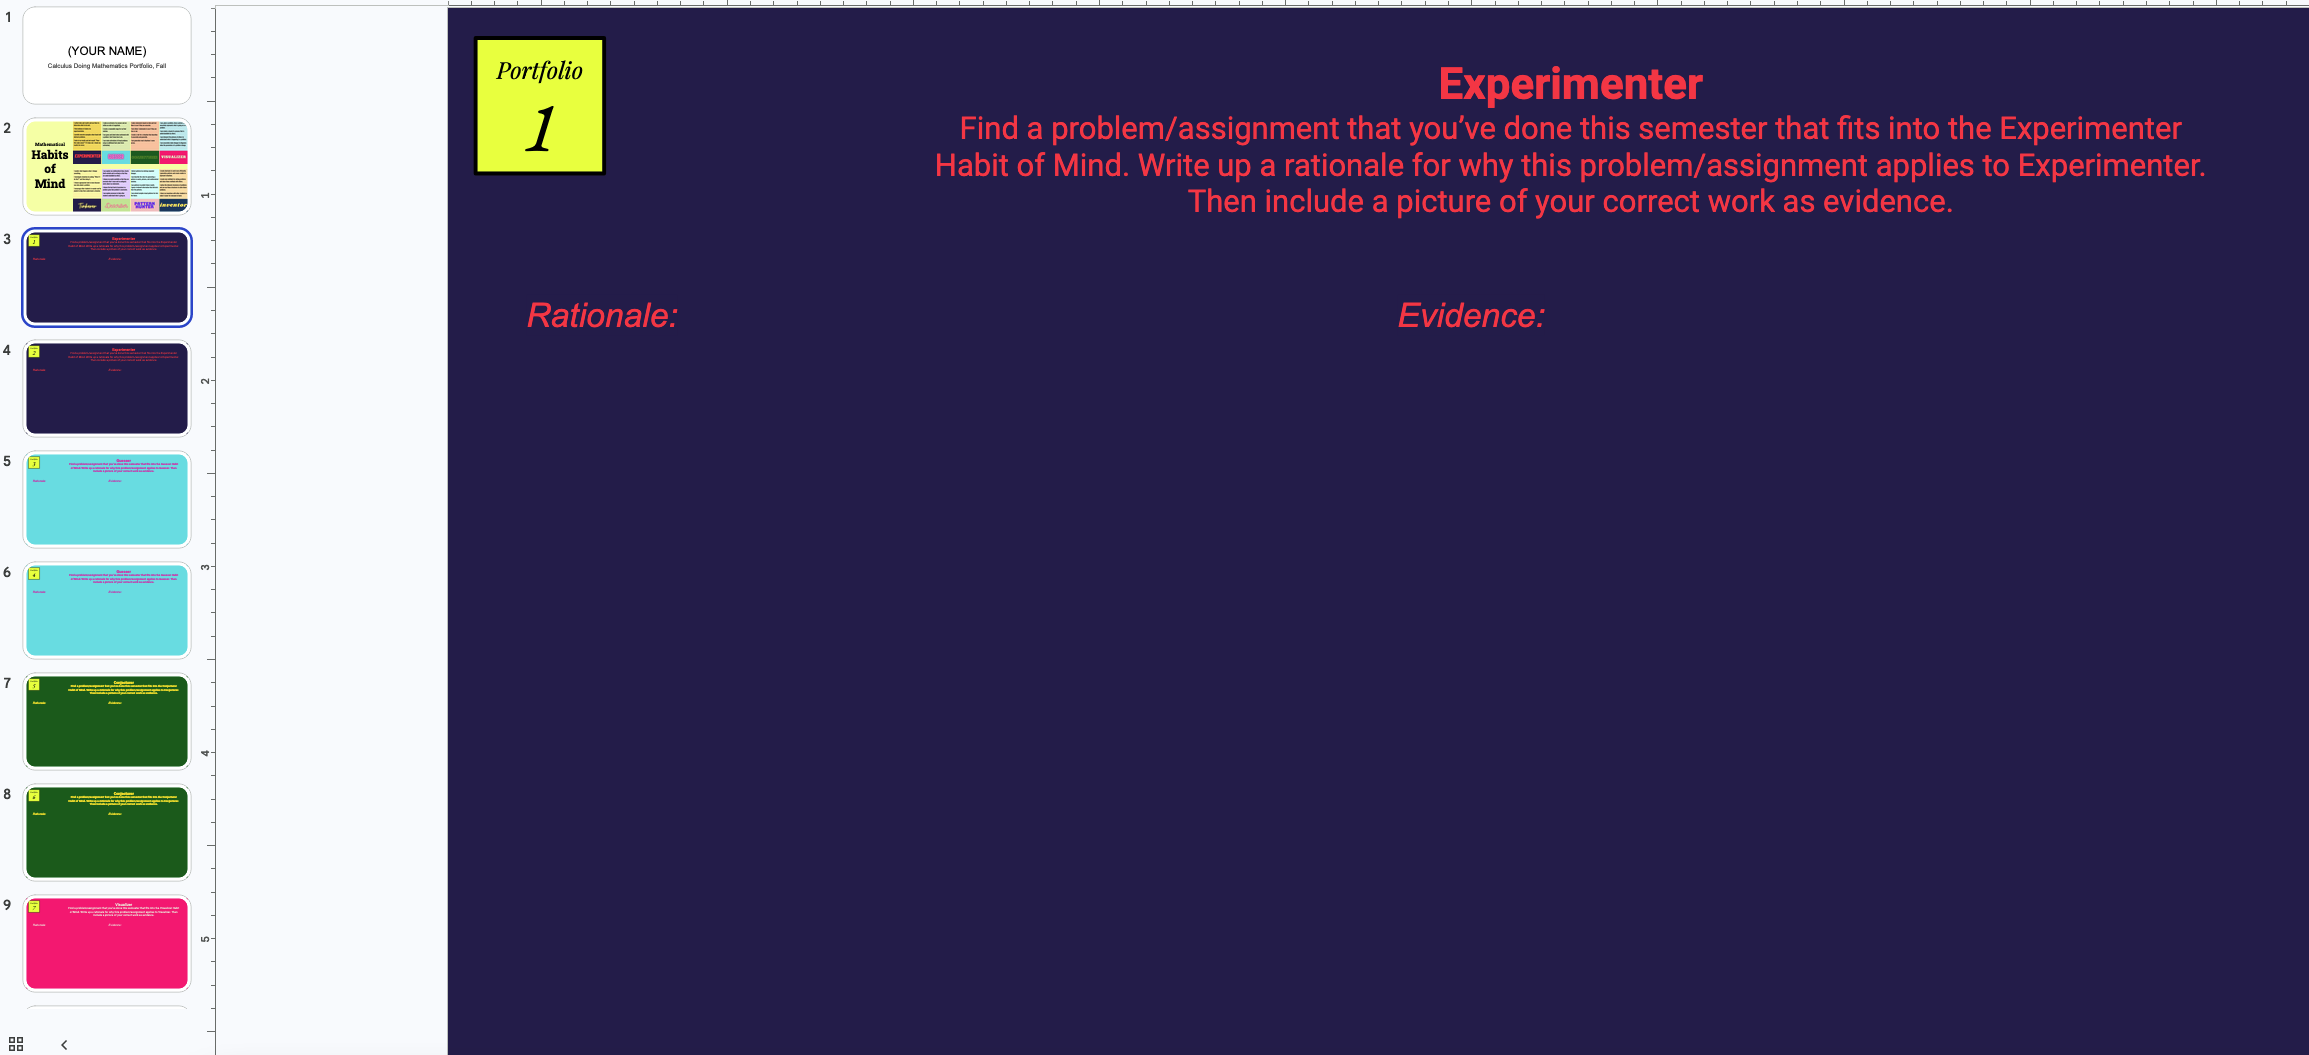
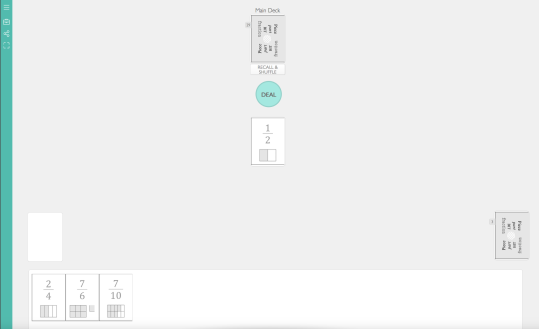
Now I do the portfolio as an ongoing Google Slide. You can see the template for the portfolio I used for Calculus last fall here. Our school has a 7-day cycle, and once a cycle we have a double-period. So for that class, in the second half of the double I’d have a quiz about that cycle’s content (counting for Knowing Mathematics), and then afterwards they would work on their portfolio, picking one piece of classwork and one piece of homework from the cycle to reflect upon and include. This let me keep on top of the grading of the portfolio better than saving it for the end of the quarter/marking period, and also made it easier to make sure the portfolio was actually a collection of their work from the whole semester. They had to do two pieces per habit of mind, although usually I would wind up with only 16 done for the semester, not 18, to have a little wiggle room (because it’s hard to get them all). To make up for that, I include two extra slides for the work they were most proud of that quarter.


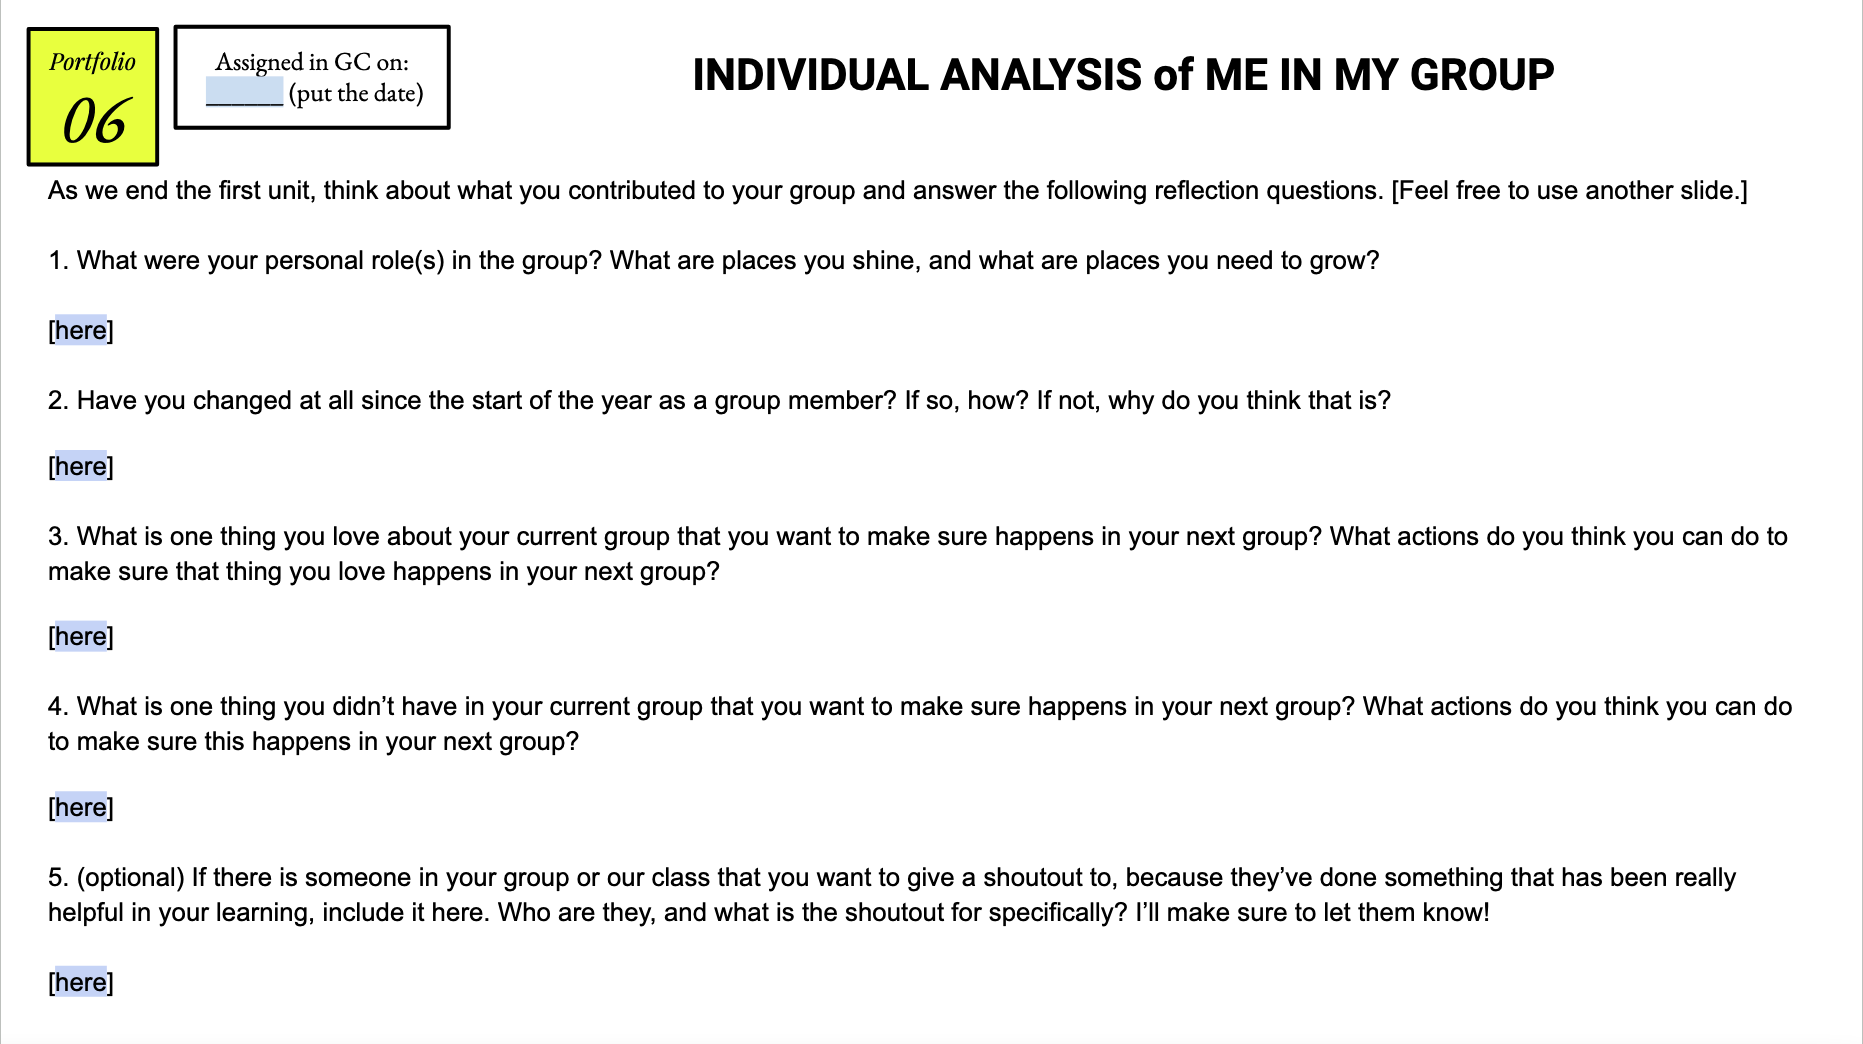
The Being Mathematicians Portfolio has a wider variety of assignments. Some will be reflections on how they work with their peers:

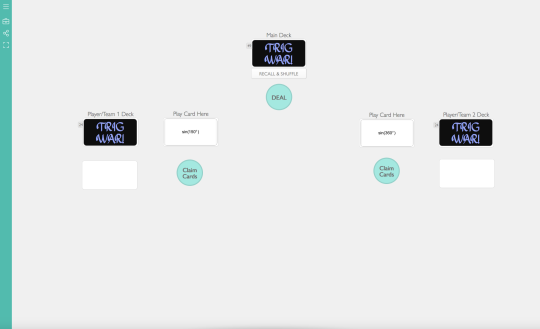
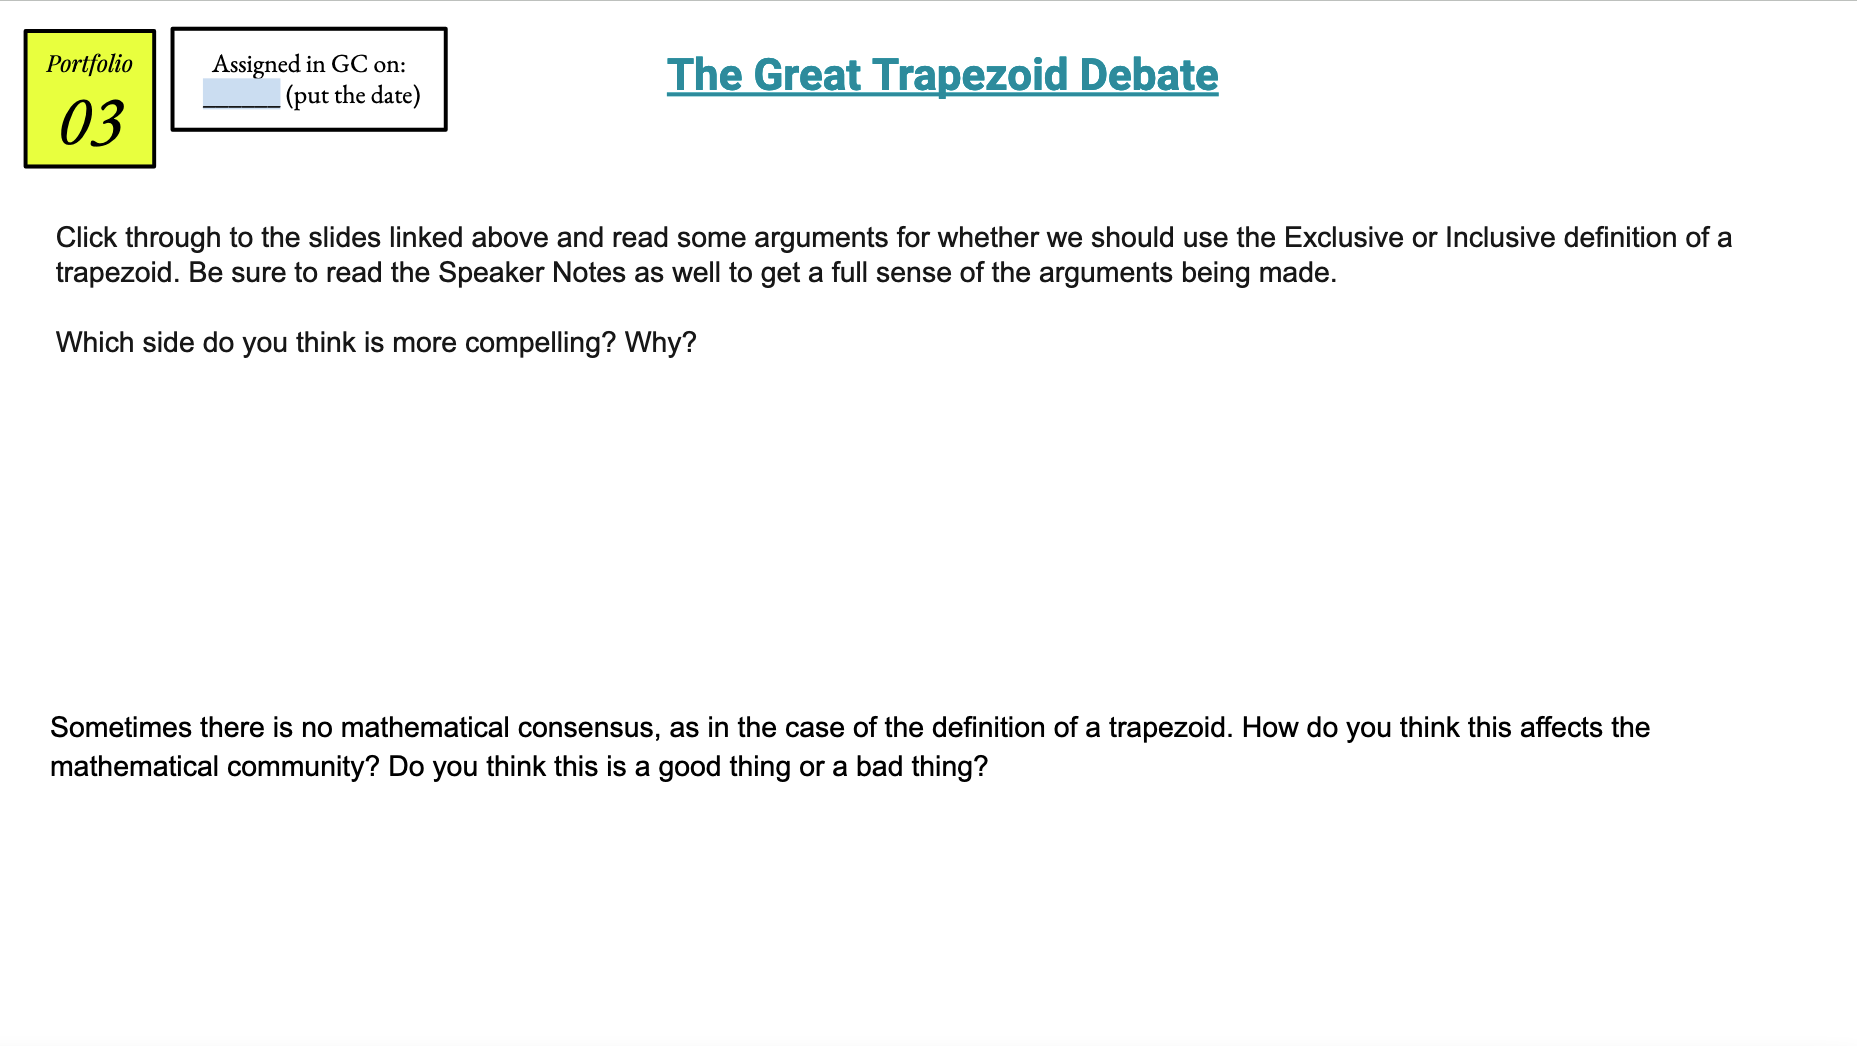
Some will be about mathematical debates:

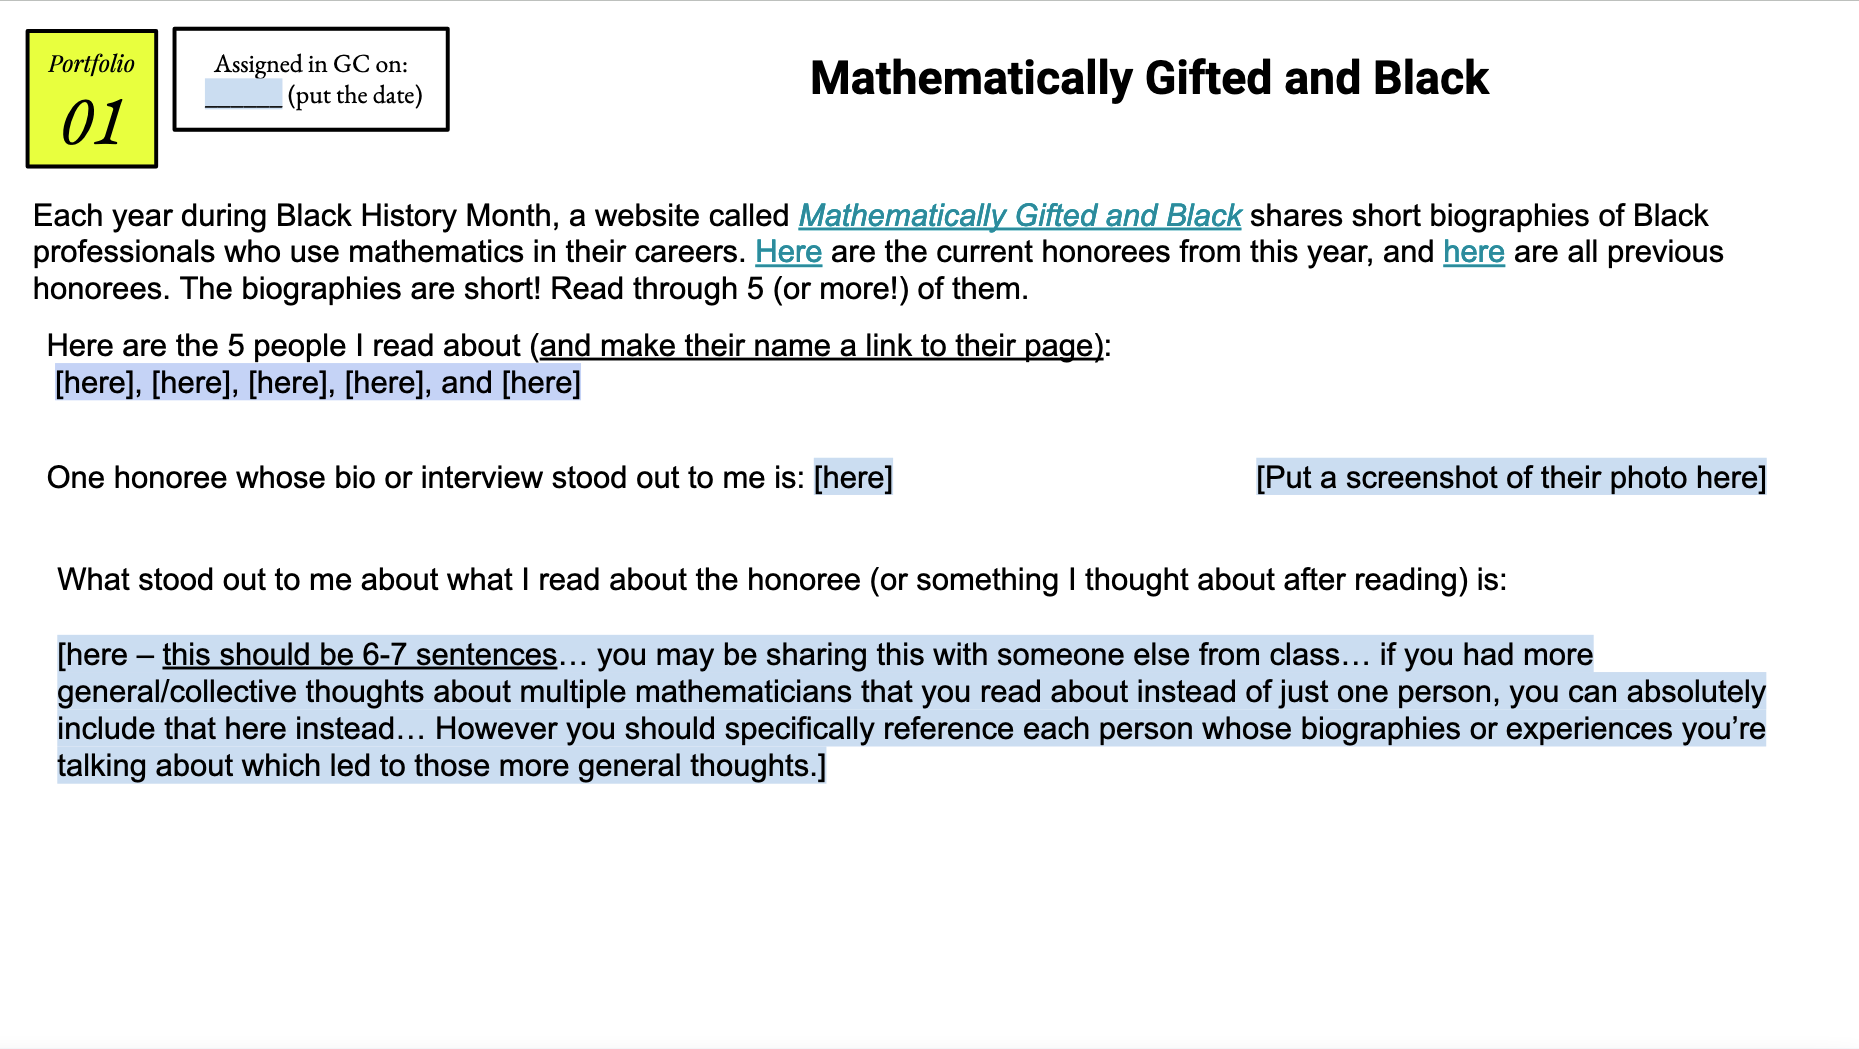
Some will be learning about mathematicians (usually from underrepresented groups) or mathematics from underrepresented cultures.

Sometimes news in the math world, or other modern mathematics:

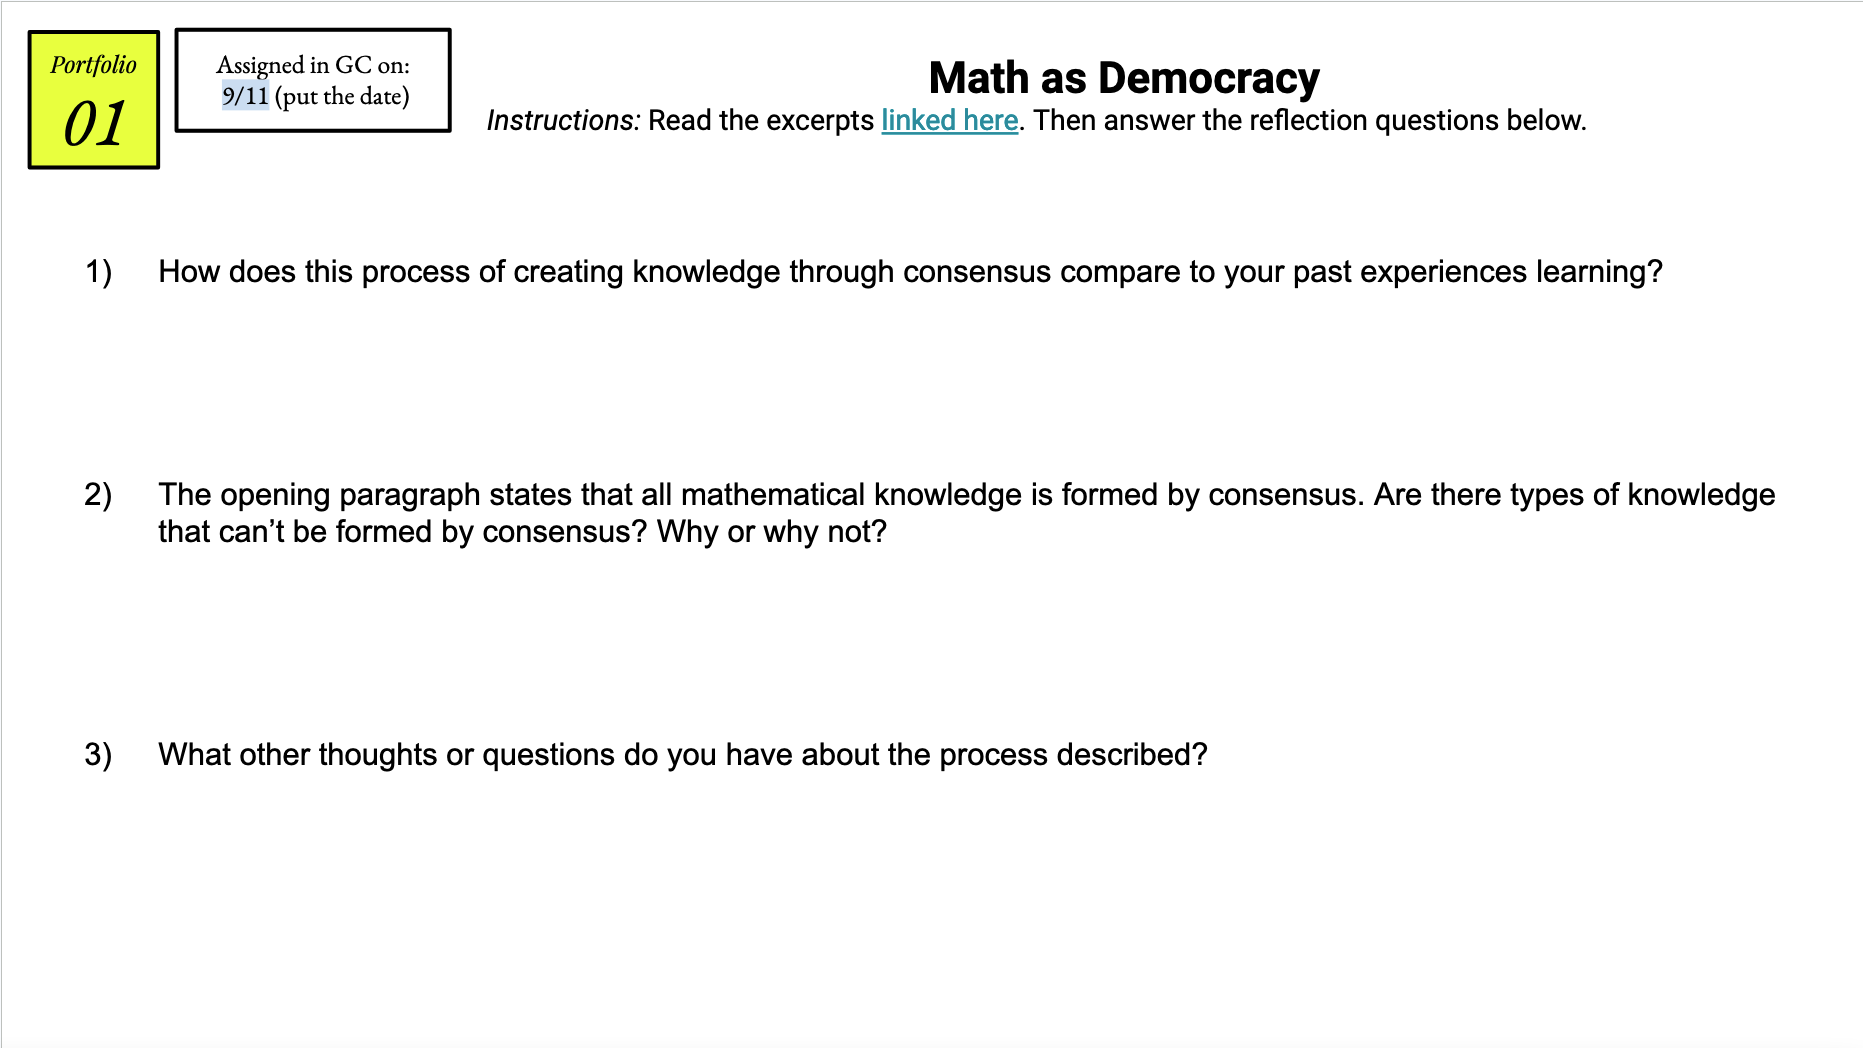
Sometimes about what it even means to do mathematics:

Students will occasionally get these as homework assignments, and we’ll usually discuss them the next class. (I’d like to be more consistent about it, as I am with the Doing Math – maybe that’s a goal for this year.) I’d also gladly take suggestions for assignments in any of these categories, or if you think there are subcategories I didn’t really hit on!

Here you can find the entire year’s worth of BM Portfolios for Geometry and Calculus. (About half of the slides were made by Sam. Wonder if you can guess which are made by whom!)

In both geometry and calculus this year the opportunity has come up to ask, “What is a mean average?” Students can usually pull together an answer that gives me a procedure (“add them up and then divide by how many there are”) but not one that really explains what that procedure shows.

With my tutoring students, I usually get to show them the method that my mother taught me when I was young, that I’ve never seen elsewhere. The procedure works by answering the question from the previous paragraph: a mean average is the value you’d have if the quantity were distributed evenly. (If we have 20 total cookies, how many to give each person so they are the same. If we have a certain budget for salaries, how to adjust them so everyone gets paid the same.)

So the method my mother taught me works that way – not adding and dividing, but redistribution. Let’s see an example.

Let’s take these five numbers I got from rolling a d100 five times. I want to average them. First, I’m gonna take a guess of around what the average is. The 10 is gonna pull it down a lot, so let’s guess the average is 70. So first I’ll redistribute the numbers from the ones larger than 70 to the ones lower than 70, like so.

Okay, now 4 of the numbers are the same, but the last one is too low. At least now when I redistribute I can take the same amount from all of them. Let’s do 5.

Pretty close! We have that 1 spare, so we’ll break that into a fraction, giving us a mean average of 65.2.

This idea of redistribution helps clarify the average value of a function or the average rate of change in calculus. Average value of a function is the y-value we’d have if we had the same total value (area) but redistributed so that all the y-values are the same (a constant).

The function in black, and its average value in purple.

The average rate of change of a function is the rate we would be going if we were going at a constant rate (aka draw a straight line, the secant).

You may be thinking that’s great, but often adding and dividing will be a cleaner and faster algorithm, and you’re not wrong. However, this method really shines when you have a question like one of these.

So let’s think. We have four tests, but we don’t know the fourth one.

We do know that we want an 89 average, which means we want all of the tests to be equal to 89. So let’s do that.

So we need a total of 10 extra points to get to that 89 average. Those points can’t come from nowhere – they have to come from the 4th test.

Therefore, that last test must be 99. Perfectly balanced, as all things should be.

This year when I was in my intro to integrals unit, I tried to look back at this blog for the second integral game I know I played (besides this one), and saw I hadn’t blogged about it. I had tweeted about it, but now I’m thinking, you know, I should, uh, archive things that I only tweeted about in a more permanent place, in guess Twitter doesn’t last much longer.

Anyway, this game is based on The Product Game, with the same structure of turns – players take turns moving a token on the bottom rows, that then determine which square in the top section, where the first player to get 4 in a row is the winner. (I usually have students play in teams of 2, but I’ll keep saying “player” go forward.)

The idea here is that the bottom rows represent the limits of a definite integral. One player plays as the Upper Limit, and the other as the Lower Limit. Once both limits are placed, the player who most recently went calculates the value of the definite integral on the accompanying graph, then covers the square in the top section with the area. (Remember that if the lower limit is greater than the upper limit, the sign is switched!)

Making the function that would give a variety of answers was a fun challenge. After coming up with a graph I thought looked good, I wound up making an excel sheet to calculate all the possible definite integrals to see how balanced it was, and adjusted.

I’ll include that excel sheet as well, as it’s useful for checking answers (as a teacher), although of course each team should be checking each other. After doing a bunch of different integrals on the same function, students often realize they can use their previous work to help them find new answers, reinforcing the cumulative nature of integrals.

Files

I recently wrote a post about some math I did for Genshin Impact on Reddit, and I figured I’d post it here, more for the math part than the game part. See below (with additional edits for clarification for non-players.)

With the release of Kuki Shinobu and her expedition talent (which Yelan and Shenhe also have, but I didn’t pull them, so I wasn’t thinking about it), I started to wonder about the comparative benefits of these talents vs the quicker expedition talents of Bennett/Fischl/Chongyun/Keqing/Kujo Sara.

Shinobu has the following talent: “Gains 25% more rewards when dispatched on an Inazuma Expedition for 20 hours.”

Sara has the following talent: “When dispatched on an expedition in Inazuma, time consumed is reduced by 25%.”

The first thought is to compare them directly. Shinobu gives 25% extra rewards every 20 hours, and Sara gives regular rewards 25% faster, so every 15 hours. While both say 25%, you are actually collecting rewards with Sara 33% more frequently, and so it is a better talent. (Over the course of 5 days, Sara would get you 40000 Mora, while Shinobu would get you 37500.)

Of course, that requires doing your expeditions immediately upon completion, which will require a shifting schedule and waking up in the middle of the night and such, and is thus fairly unrealistic. So let’s look at a more realistic model.

It would be reasonable to check Shinobu‘s expedition once a day, as 20 hours is close to 24. With Sara’s 15, however, you could do a 2-1 cycle: on the first day, check right when you wake up and right before bed (as most people are awake 16 hours), and then the next day check it in the middle of the day. (For example, 7 AM, 10PM, and then between 1 and 4 PM the next day, so it ready by 7AM the next day. This gives you some wiggle room.)

With this method, Sara is doing 50% more expeditions compared to Shinobu‘s 25% bonus, an even bigger difference than before! Over a 6-day period, Shinobu would bring 37500 Mora, while Sara would get 45000.

However, it’s pretty easy to mess up that 2-1 cycle. Sometimes I would have a class when my expeditions were done, and so couldn’t check, and then wouldn’t remember until after work, which would make my morning expedition late, and then my night one would fall until after I went to sleep. So now my question is, how often can I mess up the cycle and still have it be better than Shinobu?

Consider that same 6-day period. If I mess up on one day, it actually doesn’t change anything. (My 2-1-2-1-2-1 cycle becomes 2-1-1-2-1-2, and the next cycle of 6 days is 1-2-1-2-1-2, so still 9 expeditions per cycle.) However, the second mistake will make it so there’s only 8 expeditions per 6 days, which is equal to Shinobu’s. Similarly, the 3rd mistake is fine but the 4th one will drop you below Shinobu’s bonus rate.

So one way to look at it is if you can keep a rate of 2 double-days every 6 days, Sara and Shinobu are tied. If you can do more frequently, Sara is better. If you can’t, Shinobu is better.

Another way is to think more long term. Over a 30-day period, you would need 11 or more double-days for Sara to beat out Shinobu. So you could mess up on 9 days and still come out ahead (30% error rate). Over a 300-day period, you need 101 or more double-days, so you can mess up 99 times (33% error rate). As you might be able to tell, this limit approaches 1/3, so you can mess up on average (fewer than) 1/3 days and still come out tied or ahead.

BYORF

One of the other games I made this year was during our rational functions unit: BYORF, which stands for Build Your Own Rational Function. (This was originally a placeholder name, but it kinda grew on me.)

BYORF is a drafting game, a la Sushi Go or 7 Wonders. You play over 2 rounds (because that fit best in our 45 minute period – 3 rounds might be better with more time?), drafting linear factor cards to build into rational functions that match certain criteria. Here’s an example of a round between two players.

In this example, the left player used only 4 of their linear factors (as you don’t need to use all 6). Then we can compare each of the 5 goal cards, which are randomized each round. L has 0 VA left of the y-axis, while R has 2, so that is 3 points to R. L has a hole at (-2, 1/3) while R has a hole at (-1, -2), so L gets 5 pts. They both have a HA at y=-1, so both score those 4. Then we have the two sign analysis cards, which score points if you have that formation somewhere in your sign analysis. R has the first one (around x=3) and both have the second one (L around x=1 and R around x=-3). So after one round, both players are tied with 11 points.

I hope that gets the idea across. The fact that students need to check each other’s work to make sure the points are being allocated correctly builds in a lot of good practice. After we played the game, I did a follow-up assignment to ask some conceptual questions (which is where the above example comes from). I’ve also attached that here.

I hope you have some fun with BYORF!

Letter Scramble

In our combinatorics unit in pre-Calculus, we tend to look at every problem as a letter rearrangement problem. This lets us move beyond permutations and combinations to model any problem involving duplicates. I wanted to build a game that had the students quickly calculate the number of arrangements for a given set of letters, so I came up with Letter Scramble.

The idea behind the game is that students have a set of goal cards with the number of arrangements they want to reach, and a hand of letter cards. On each player’s turn they can play a letter card to change the arrangement, and thus change the total possible number of arrangements. (They can also skip their turn to draw more goal cards, a la Ticket to Ride.)

I calculated all the possible answers you could get using 7 different letters and up to 8 slots, including if some of those slots are blank (and thus make disjoint groups), then determined which of those answers repeat at least once, and assigned them scores based on that.

Possible numbers of arrangements on the left, how many times they repeat in the second column, and the points I assigned them in the third.

One interesting thing about the gameplay is it promoted relational thinking. Instead of calculating each problem from scratch, you can based it on the previous answer you calculated. (So, for example, if the board read AABBCD, that would be 6!/(2!2!) = 180. But if you change that to AABBBD, one of the denominator’s 2! changes to 3!, which is the same as dividing by 3, so it’s equal to 60. No need to calculate 6!/(2!3!) directly.

Some examples of scored goals:

1! * 3!/2! = 3
5!/(2!3!) = 10

I had an extra day to fill for one of my sections of calculus, thanks to the PSAT, so I set about thinking up a game I could play. I gotta tell you, as much as there is a paucity of good content-related math games out there, it’s extra so as you move up the years in high school. I can still find a good amount of algebra and geometry games online, but Algebra 2? Precalc? Calc? Fuhgeddaboutit. Well, I’m teaching both Pre-Calc and Calc this year, so I guess I’ll just have to make them myself. (I brainstormed two more during said PSAT, so those might happen soon enough.)

Starting layout for The Integral Struggle

We just covered function transformations and how they affected integrals, so this game hits on that topic. (Yeah, we’re doing integrals first.) Here’s how it works: there are 3 functions/graphs, each of which has a total area of 0 on the interval [–10,10]. One team is Team Positive, and the other is Team Negative. Teams take turns placing numbers from –9 to 9 that transform the function and therefore transform the area. Most importantly, they also place the numbers in the limits of integration, so they can just look at a specific part of the graph.

With three functions, it becomes a matter of best of 3 – if the final integral evaluates to a positive number, Team Positive gets a point, and vice versa. If it’s a tie at the end of the game, because one or more of the integrals evaluated to 0 or were undefined, then redo those specific integrals. (I discussed with the students whether it would be better to have it be the total value of all 3 integrals instead of best of 3, but I think that makes the vertical stretch too powerful.)

That’s it! Let me know what you think. Materials below.

Okay, here’s a game I came up with off the cuff today. It kinda worked, but I guess if other people tried it and gave feedback, that’d be swell.

Players: 2 (or 2 teams), each with two colors

Board: A 10×10 grid.

The game is played in two phases. In the first phase, each team takes turns placing points on the grid, until each team has placed 5 points. The origin always is claimed as a neutral point. Every point has to be on a lattice point. (In the example below, I was blue and my student was yellow.)

In the second phase, on their turn, each player may place a new lattice point and form a line with one of their original 5 points. If that line then passes through one (or more!) of the opponent’s original 5 points, those points are stricken. If one player can strike out all of the other player’s points first, they win. (If not, then whoever strikes out the most.)

There is one caveats to round 2 – when a line is drawn, determine the slope of that line and write it below. That slope can’t be used again.

Image
A game in progress. I was blue&red, and have struck out 4 of my student’s points. They were yellow&black and have struck out two of mine. It’s their turn.

After playing the first time, it became clear that much of the game came down to placing the points. If you could place one of your points so it was collinear with two of your opponents, you can strike them both with a single line. (But this only works if there is space for a 4th, alternate color point in phase 2 to form the line.) You also want to place your points defensively, with weird slopes that don’t pass through a lot of lattice points, to keep them safe. The second player definitely has an advantage when placing points, but the first player has an advantage when drawing lines, so I’m hoping those balance out.

Thoughts?

I love playing math games with my students, but it’s been hard with remote teaching because so many games require physical objects. I’ve been able to play a bunch using a shared whiteboard, but there’s a limit to how many work in that method. I just discovered http://playingcards.io, though, which is a platform for playing card games online with anyone. They have built in games, but you can customize your own. I’ve taken several from the #MTBoS and my own blog and made them.

To use these files, first create a custom room. Then enter edit mode:

In the Room Options Menu, you can import a file. So download the file you want from here and import it there and the game is ready to go. You can then share the room code with students, and you can even make multiple rooms for different groups of students and jump between them.

For each game, click the image to go to the original blog post, and the title for the pcio file.

Games

Factor Draft

Math Taboo

Fraction Catch

Trig War, Log War, Inverse Trig War

Integer Deck

This last one isn’t a game so much as a resource for many other math games. It’s an integer deck, consisting of cards from -12 to 12 of each suit (and an extra 0 for each.) I colored the suits using a colorblind-friendly color palette, on top of the symbols. You can easily edit the deck (enter edit mode, then click on the deck) to remove cards from the deck or change the particular cards. It can be used for a lot of games – and helps avoid the problem of kids wondering what J, Q, and K mean. It would be a good deck to use for, say, Fighting for the Center or these Integer Games.

As I was planning my linear functions unit, I noticed a problem about someone choosing between two electric companies, with the standard idea of one having a larger start-up cost but a lower monthly rate. I realized these problems are very common, and they reminded me of of a quotation from my favorite author, Terry Pratchett:

The reason that the rich were so rich, Vimes reasoned, was because they managed to spend less money.

Take boots, for example. He earned thirty-eight dollars a month plus allowances. A really good pair of leather boots cost fifty dollars. But an affordable pair of boots, which were sort of OK for a season or two and then leaked like hell when the cardboard gave out, cost about ten dollars. Those were the kind of boots Vimes always bought, and wore until the soles were so thin that he could tell where he was in Ankh-Morpork on a foggy night by the feel of the cobbles.

But the thing was that good boots lasted for years and years. A man who could afford fifty dollars had a pair of boots that’d still be keeping his feet dry in ten years’ time, while the poor man who could only afford cheap boots would have spent a hundred dollars on boots in the same time and would still have wet feet.

This was the Captain Samuel Vimes ‘Boots’ theory of socioeconomic unfairness.

– Men at Arms

I wanted to share this concept with my class, so I looked for problems. One thing I realized, though, was that many of these problems involved one person choosing between two things. This makes it so there is one clearly correct answer.

But oftentimes, in the real world, people don’t have a choice. One person can afford the upfront cost to pay less in the long run, but another person can’t, and winds up paying more overall, as in the Pratchett quote above. So I decided to reframe the problems as comparisons between two people, to highlight that injustice.

The lesson started with a model problem, then I gave each group a different problem from the set below.

(I went through this page of unisex names to make all of the problems gender-neutral.)

Each table worked on a different problem (with some differentiation on which group worked on which), then they jigsawed and, in their new groups, they shared out their problems and how they solved them. Then, most importantly, they looked for similarities and differences between the problems.

We then read the Pratchett quote and discussed its meaning, and students had to agree or disagree (making a claim and warrant for each). We had a good discussion on whether it really applied to today’s world or not.